To investigate this long-standing issue, scientists devised a technique known as the "Happiness Index." This index gives informative data on how people throughout the world perceive their general well-being and quality of life. It has been painstakingly designed to assess and prioritise people's subjective well-being and happiness across national borders. The index considers a variety of factors, including life expectancy, income, social support, philanthropic levels, and trust in society and its institutions. It serves as an invaluable resource for researchers and politicians alike.
The Global Happiness Index
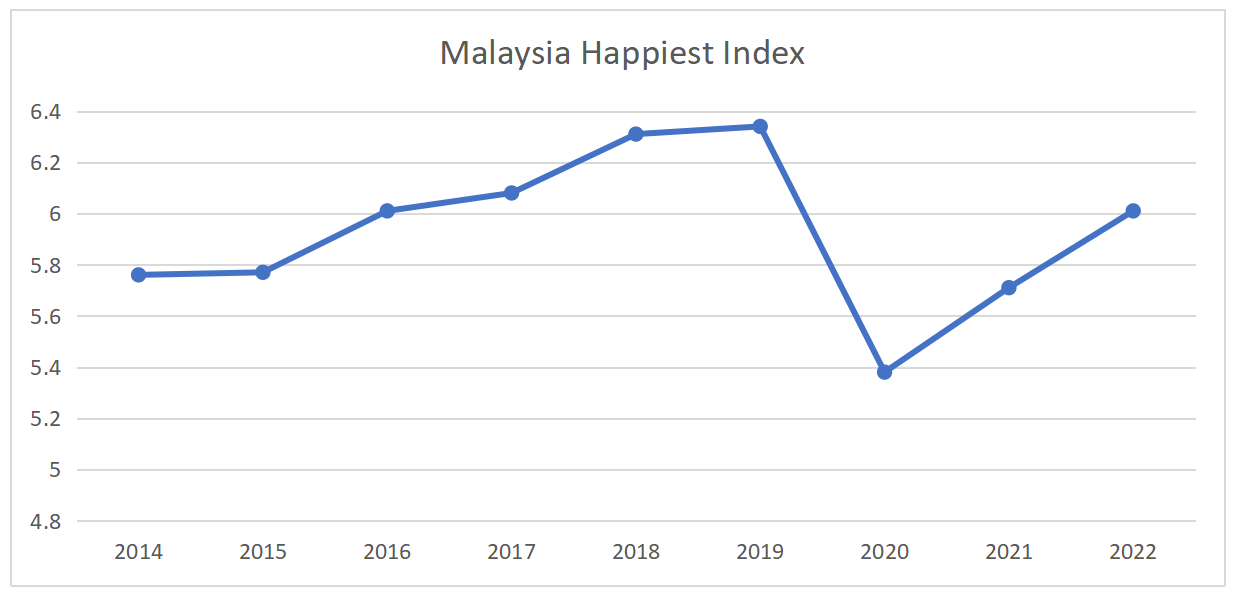
The Happiness Index, as determined by TheGlobalEconomy.com, ranks nations according to their level of happiness using a scale that goes from 0 (unhappy) to 10 (happy). Based on information from 134 countries, the average happiness score worldwide in 2022 was 5.54 points. Afghanistan came in last place with a score of 1.86, while Finland topped the rankings with an astounding 7.8. Malaysia came in at number 52 with a score of 6.01.
Malaysia's Happiness Index has continuously ranged from 5.3 to 6.3 over the years. The index of happiness and well-being in 2022 fell between moderate and moderately high. While a score close to 6.3 denotes somewhat higher well-being but is not exceptionally high, a score around 5.3 indicates a moderate level of well-being and life satisfaction with room for improvement. Although it's a good score, there is room for improvement.

(Source: The Global Economy.com 2023)
The Malaysian Happiness Index
Family, housing and environment, social engagement, health, communication facilities, education, working life, income, public safety, time use, religion and spirituality, culture, and emotional experience are the 13 components of the Happiness Index that Malaysia has established. According to state-by-state analysis in 2022, W.P. Labuan topped the Malaysia satisfaction Index with an astounding 9.29, indicating an exceptionally high degree of satisfaction. High levels of happiness were also shown by other states, including W.P. Kuala Lumpur (7.77), W.P. Putrajaya (7.28), Terengganu (7.20), and Kelantan (7.02). Particularly, Kelantan stood out with a remarkable score of 7.02, signifying a high degree of happiness. In Kelantan, all 13 of the index's components received a happy rating. Public safety, family, health, housing and environment, culture, time management, education, social interaction, employment, communication tools, emotional experience, and money were among these elements.
Conversely, a number of other Malaysian states, such as Selangor, achieved somewhat content scores on the Happiness Index. Although Selangor performed exceptionally well in several areas, the state's total score lagged below Kelantan and other highly ranked states.
Economic Growth and the Happiness Paradox
Examining the relationship between GDP (the measure of regional economic performance) and the Happiness Index reveals an interesting paradox. Certain states, like Kuala Lumpur and Selangor, have experienced tremendous economic growth, but their contribution to happiness has been less than that of states with smaller economies, like Terengganu and Kelantan. Department of Statistics Malaysia (DOSM) data shows that in 2022, Penang (13.1%), Selangor (11.9%), Pahang (10.8%), and Kuala Lumpur (9.5%) all exceeded the nation's GDP growth rate. Specifically, Selangor continued to contribute significantly to Malaysia's GDP.
Unveiling the Paradox
When we compare the GDP contributions of the states with the Happiness Index, the paradox becomes clear. Selangor and Kuala Lumpur had lower happiness scores than states with smaller GDP contributions, despite their remarkable economic growth. For instance, despite making up just 4.3% of the state GDP, Kelantan is among the happiest five states, along with Terengganu, Pahang, W.P. Labuan, and Sabah. Selangor, on the other hand, fared worse on the Happiness Index while making the largest GDP contribution of 26.2%. This paradox implies that pleasure levels are not always correlated with GDP contributions and economic growth alone. The happiness of a state's citizens may also be greatly influenced by other elements including social support, quality of life, and community well-being. It emphasises how crucial it is to take into account a comprehensive strategy for development that accounts for both objective measurements of well-being and economic indicators.
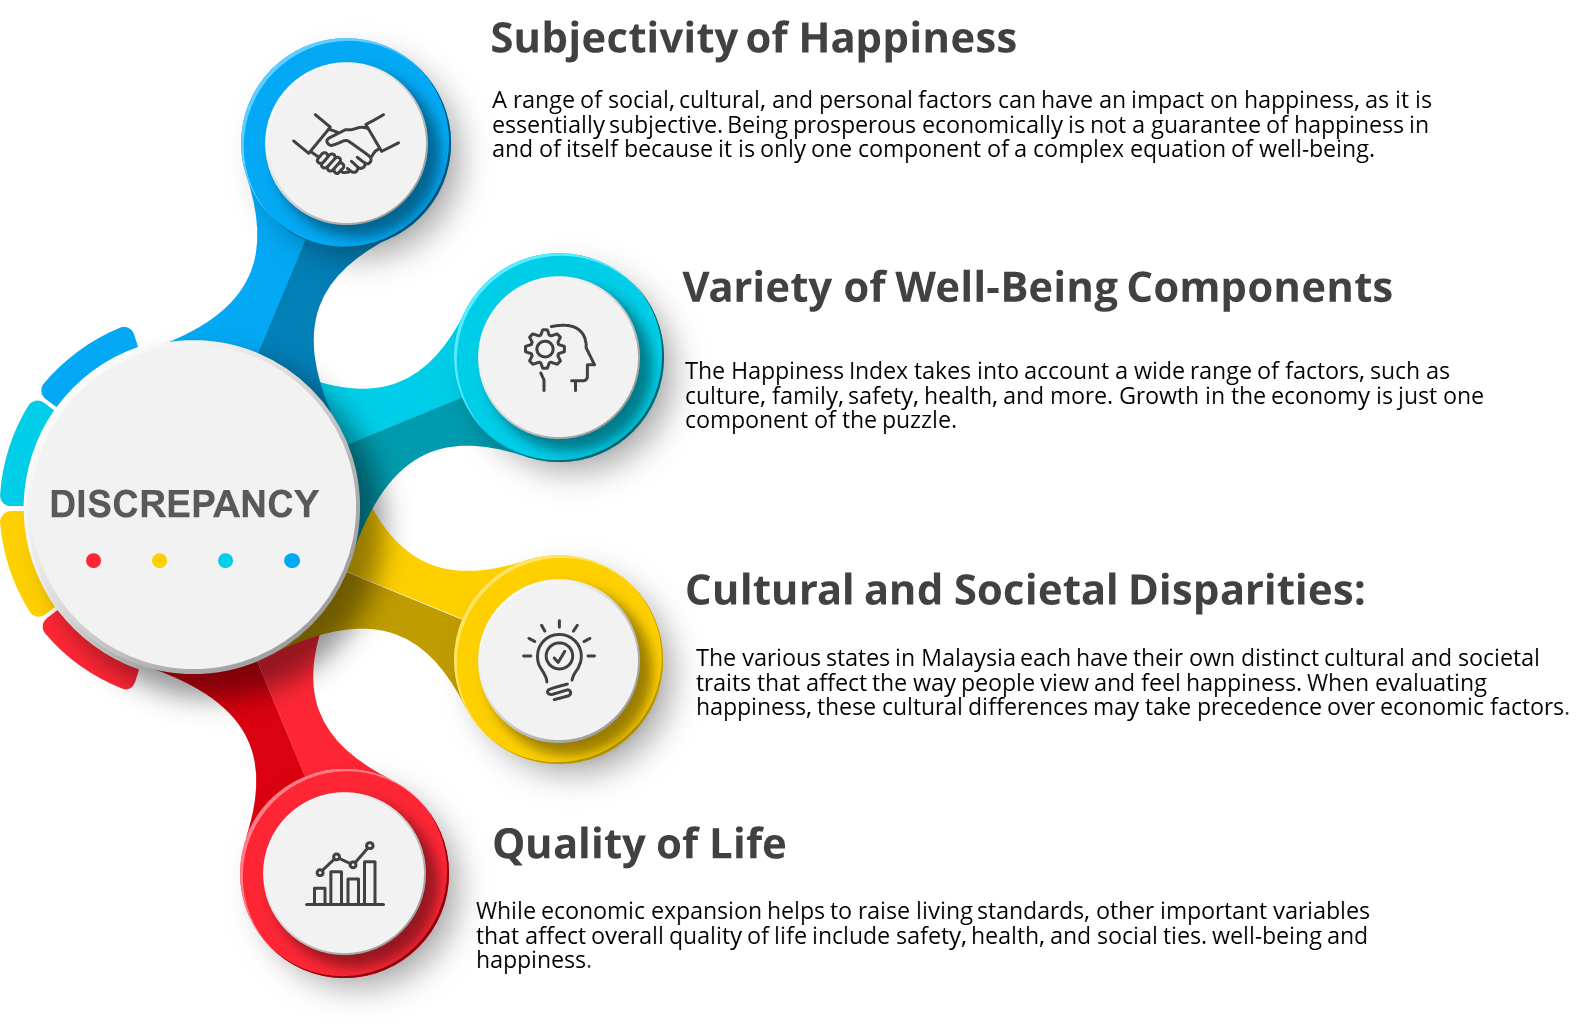
This paradox shows that happiness and GDP are not always correlated. Various things could explain this discrepancy:

Learn that happiness is a multifaceted process that is impacted by numerous factors, to put it briefly. The Happiness Index provides comprehensive data about the overall happiness and well-being of a region's people by accounting for a wide range of characteristics. To enhance the well-being of their citizen, governments and societies must acknowledge and consider these multifaceted elements. Fascinatingly, the GDP vs. happiness conundrum helps remind us that, while significant, economic prosperity is just one facet of happiness.


